Chapter 4 Missing values
For convenience, we replace all empty value to NA first.
## [1] 2838 22After data transformation, our dataset has 2838 rows and 22 columns.
We want to check if there is any missing value in our NYC job dataset.
##                                col
## Hours/Shift                   2050
## Post Until                    1803
## Work Location 1               1517
## Preferred Skills               294
## Full-Time/Part-Time indicator  198
## Minimum Qual Requirements       23
## residency                       13
## Job Category                     2
## Career Level                     2
## Residency Requirement            2
## Job ID                           0
## Agency                           0
## Posting Type                     0
## # Of Positions                   0
## Business Title                   0
## Civil Service Title              0
## Title Classification             0
## Salary Range From                0
## Salary Range To                  0
## Salary Frequency                 0
## Work Location                    0
We can see that there are total 10 columns have missing values. We decide to ignore Minimum Qualify Requirement, Job Category, Career Level and Residency Requirement because they only have less than 1% missing values in 2838 records.
We choose 5 columns that have more than 1% missing values to draw the missing pattern graph
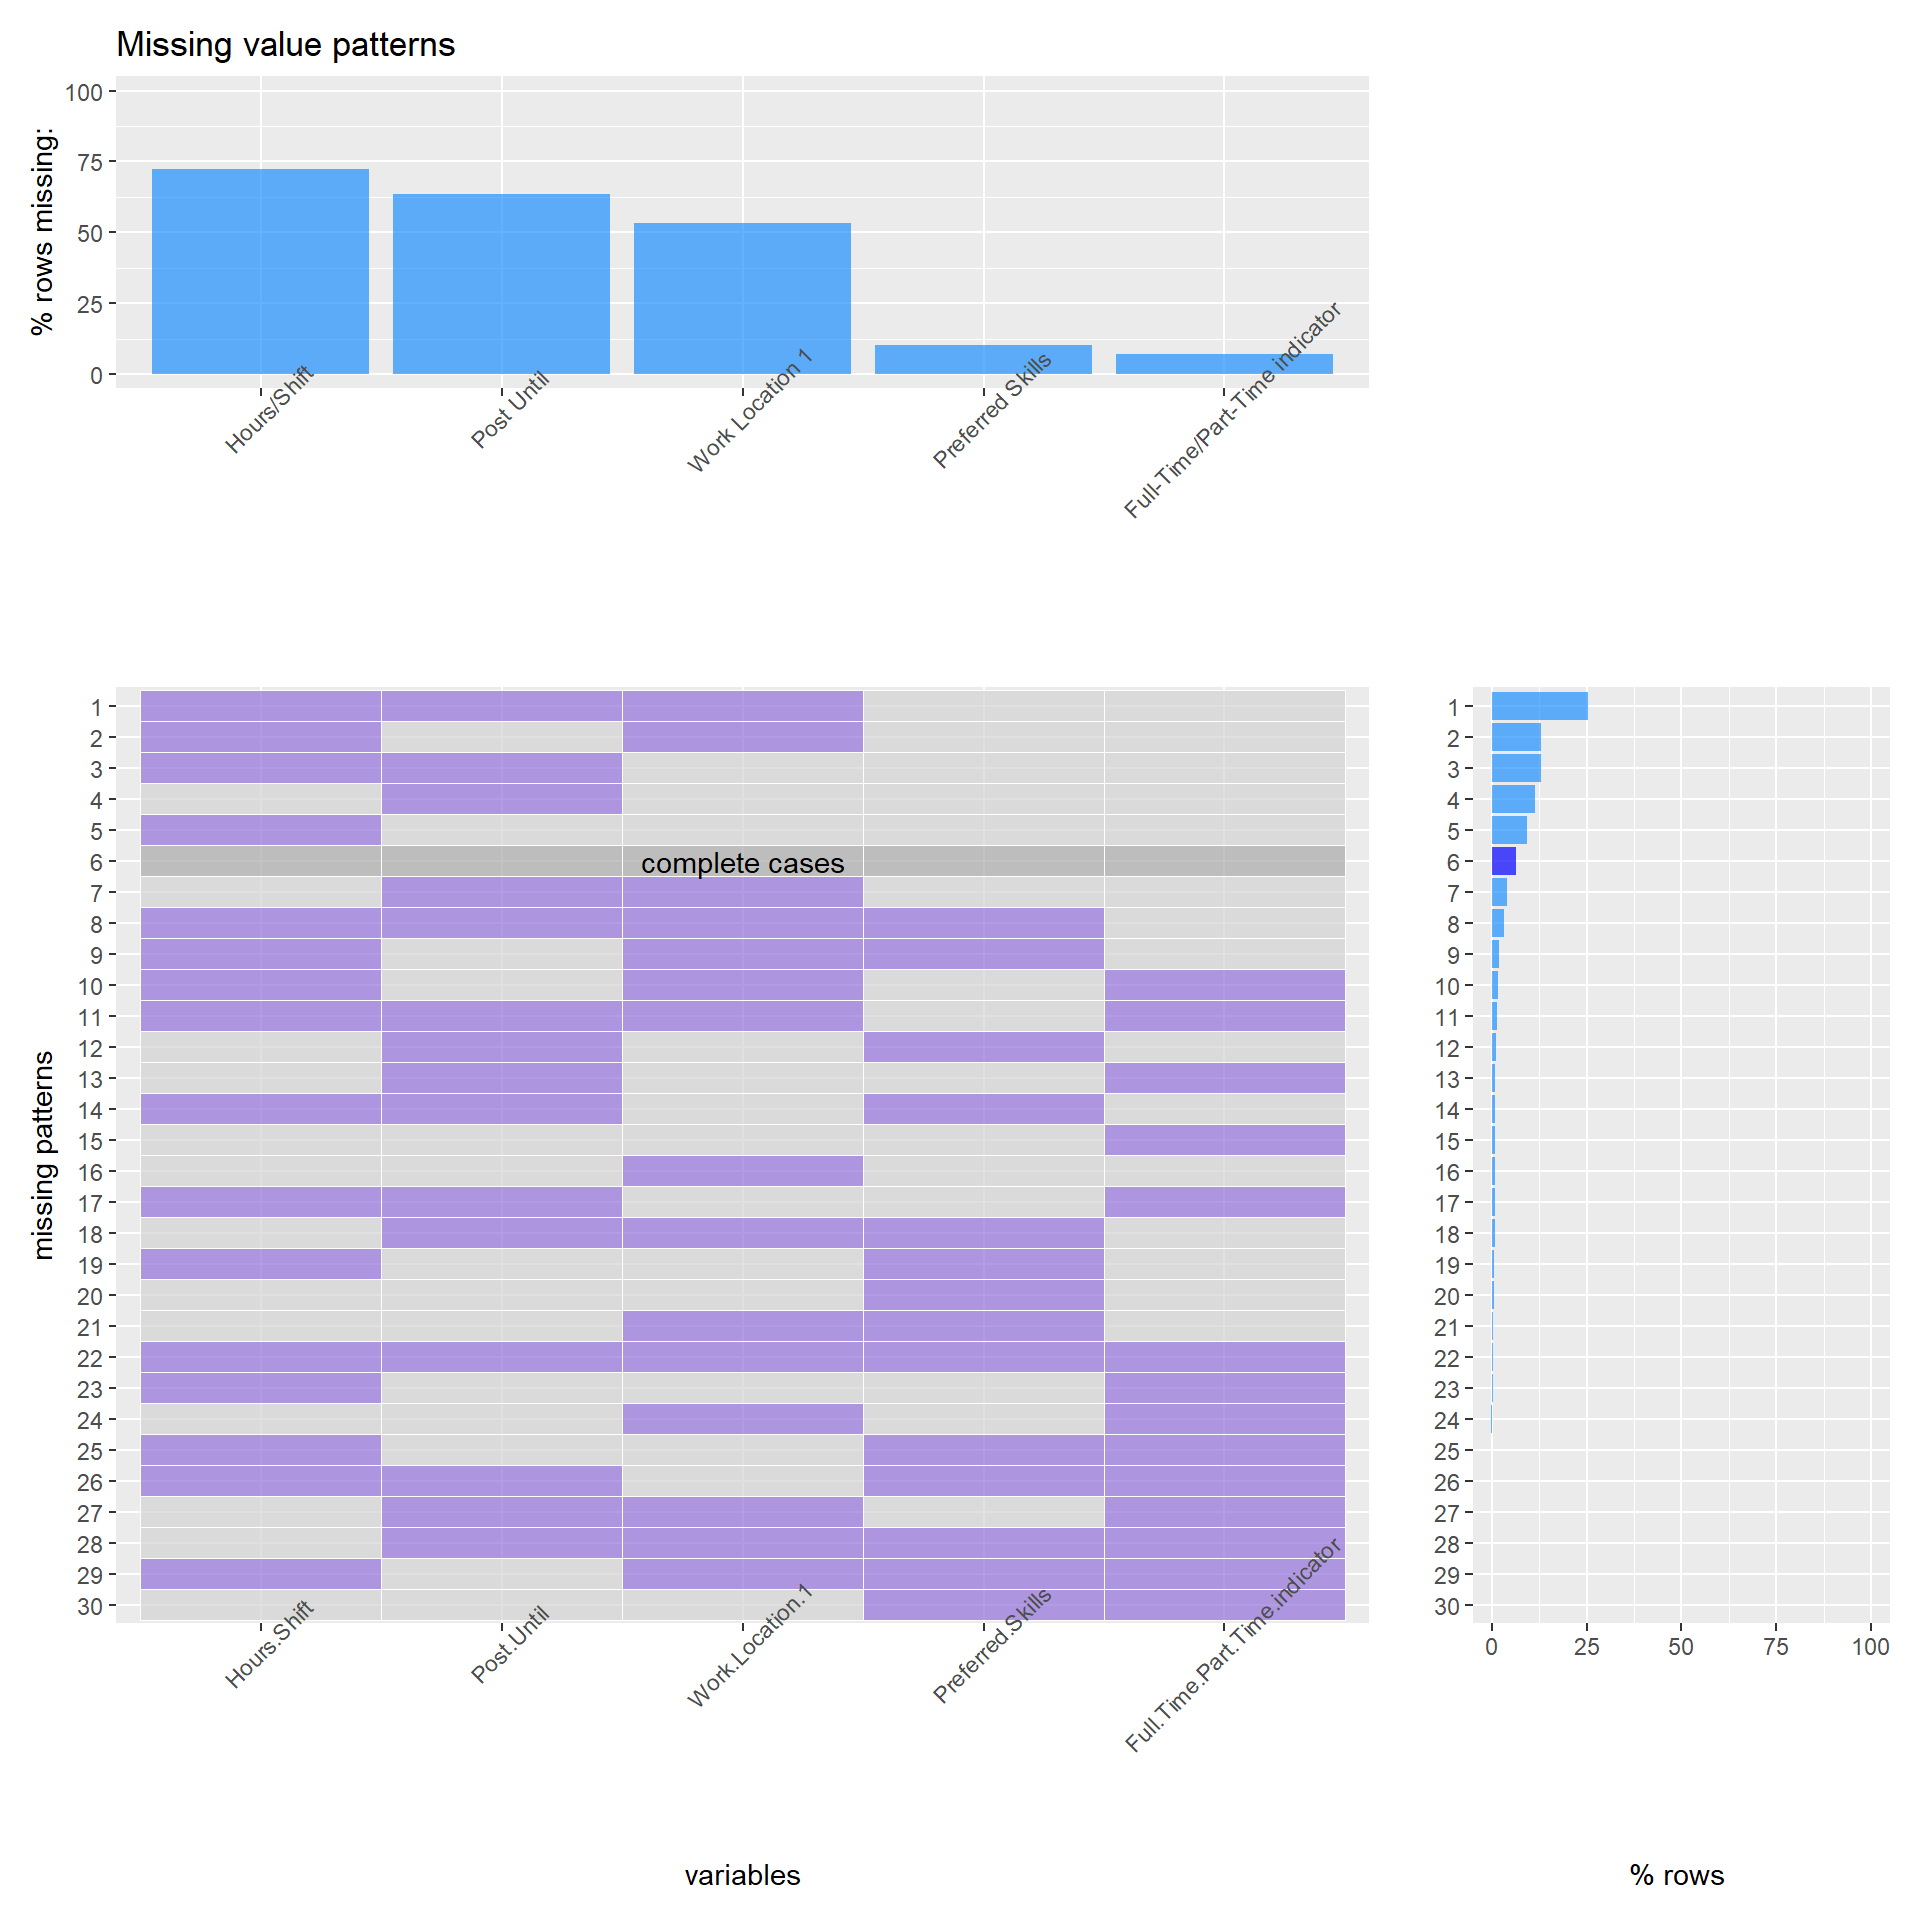 From above plot we can observed that there are 30 different patterns. There are near 7% rows recorded as complete cases.The most common pattern is missing of hours shift, post until and work location 1, about 25% of total rows. And the amount of the pattern whose missing is hours shift and work location 1 is around 12.5% of total rows, which is similar to the amount of the pattern whose missing is hours shift and post until. The reason is that for hours shift, many job postings do not have uniform standards; for post until, blank means post until filled; and for work location 1, many job postings have given their work locations in variable “Work Location” and do not one more specific work location.
The hours/Shift have over 75% values are missing, and for those values that are not lost, they are very different from each other, and are also difficult for us to classify and compare, so we decide to remove this column. The Post Until column have over 50% values are missing but we will keep it because Post Until is a date that the job post is available, and the missing means this post will remain available until filled. The Preferred Skill column have 10% values are missing. We will keep it because the missing means this post do not have preferred skill requirement. For other variables, we will determine how to deal with them when we make visualization.
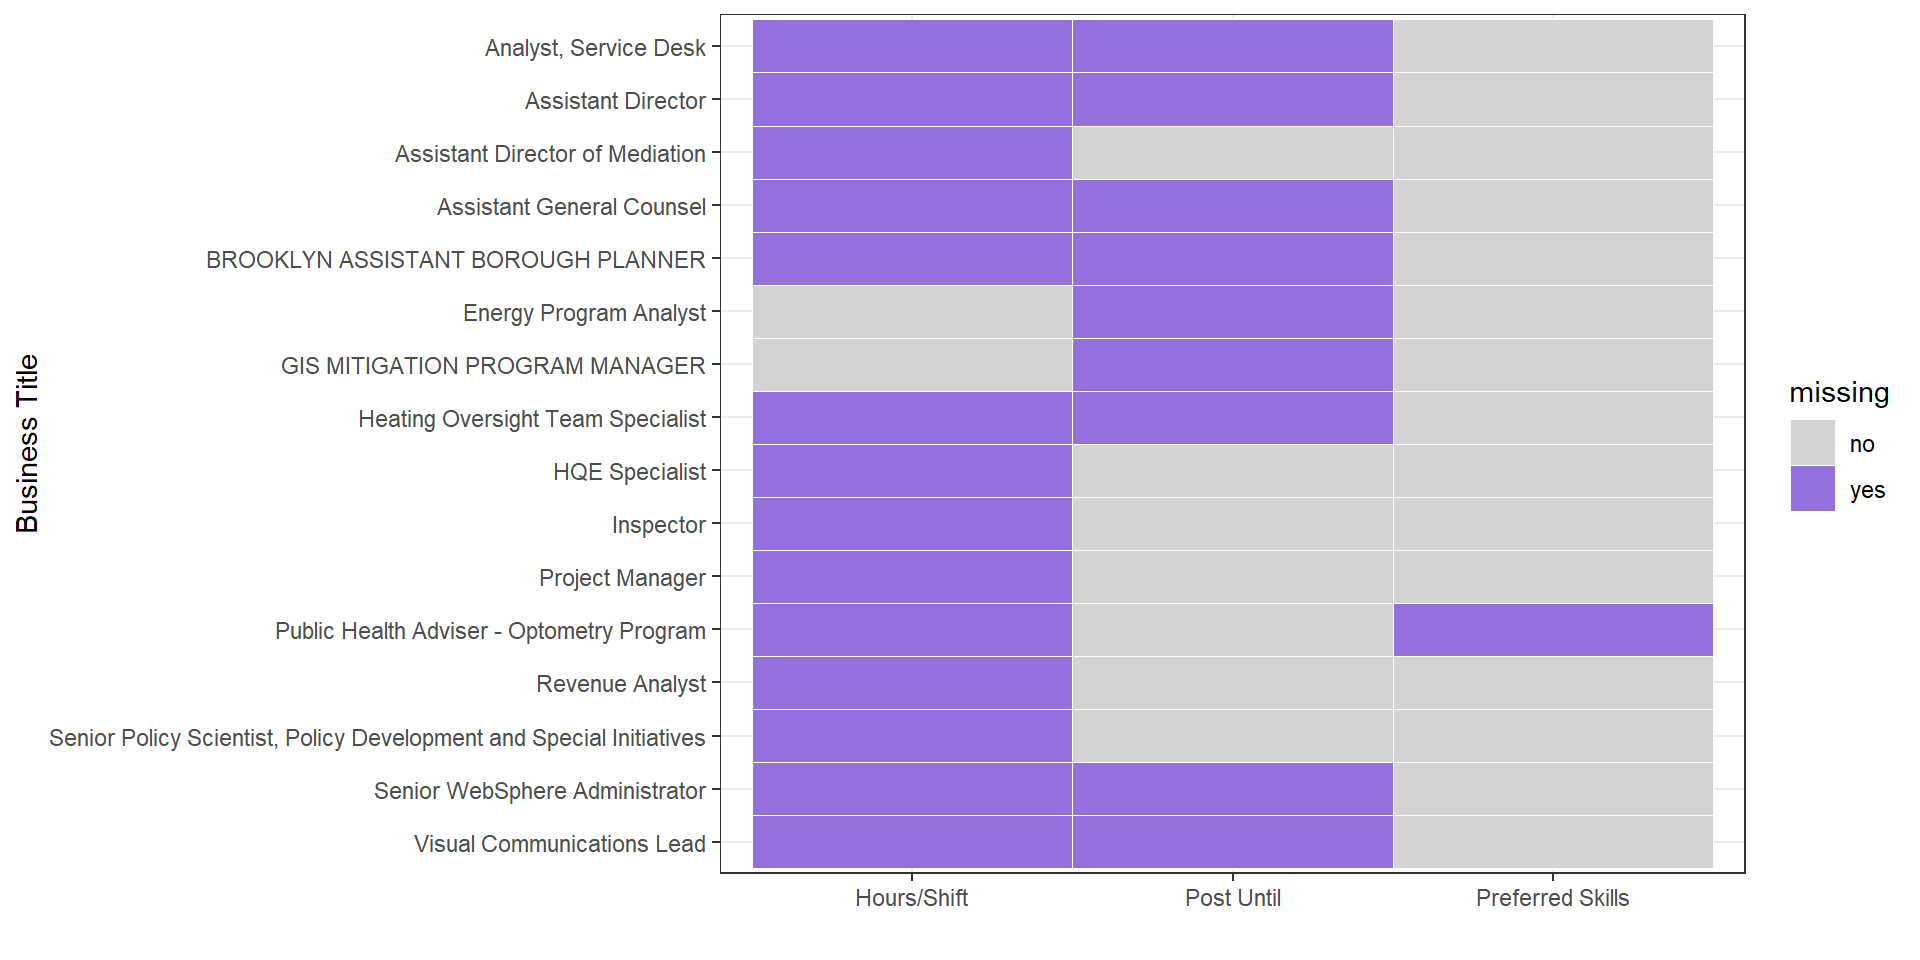
Since Business title is one of the most important variables,we choose some records to analyze the relationship and check if our decision is right. From this graph we can find most of this business titles miss “Hours/Shift”, but for variable “Preferred Skills”, almost all business titles have a value. Thus, our decision is right.