Chapter 5 Results
5.1 Most major job category
To help job seekers realize how many job postings are available for each job category and the competitiveness of various categories of jobs so that they can choose a more suitable job, We want to know the demand for different categories of jobs in New York city. From this job posting data variable “Job Category”, for each job posting, our group extract the job category that can best represent the job, and store them and their counts in a new data frame “category”.
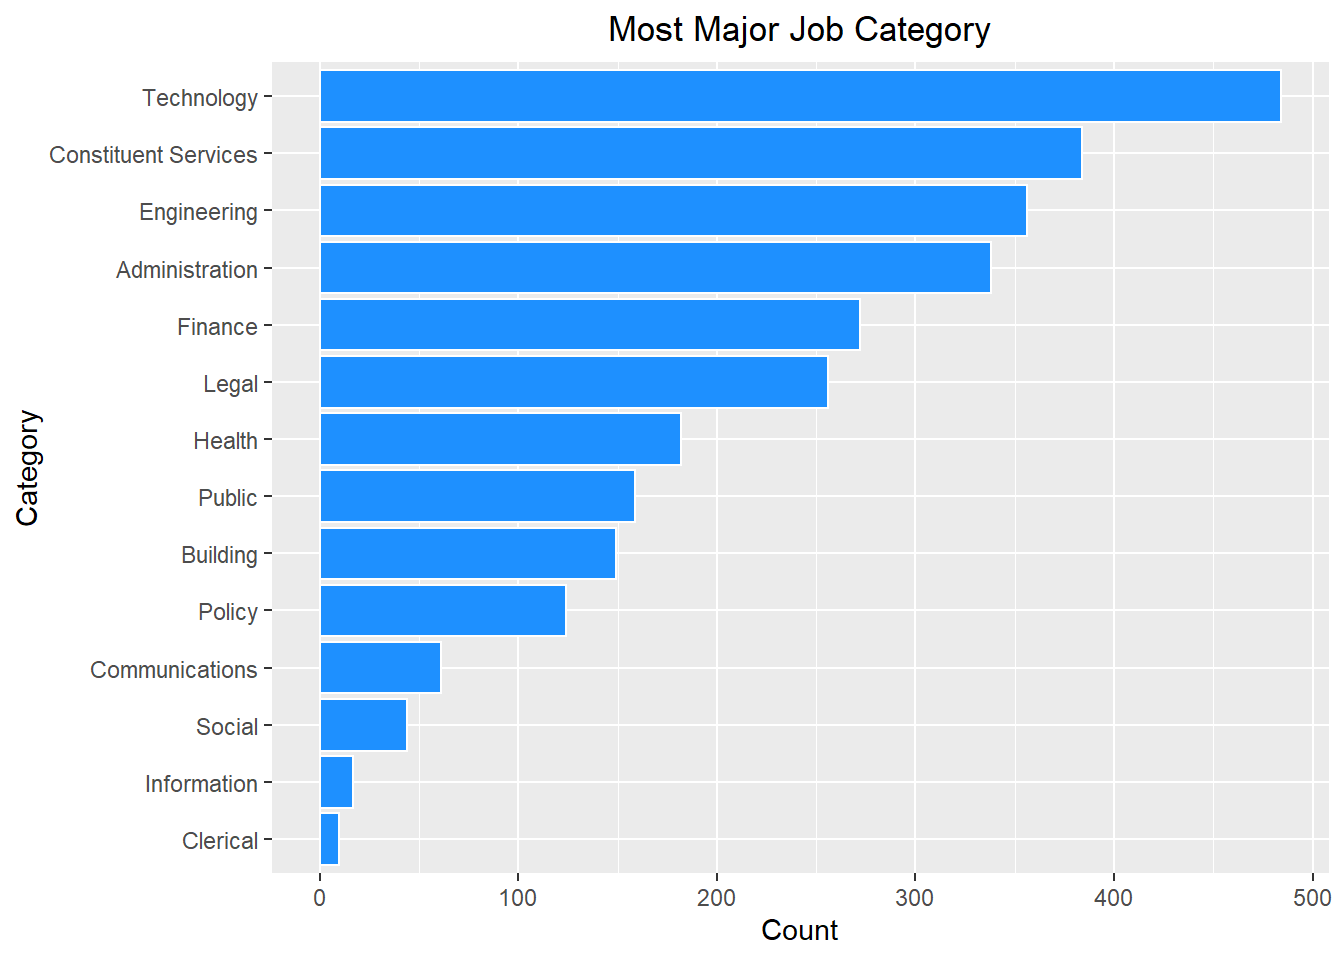
From the graph above, we can find that the number of job posting for “Technology” is largest, which is more than 450, and the number of job posting for “Clerical” is smallest. For “Technology”, “Constituent Services”, and “Engineering”, these three job categories have the top three number of job postings. If people want to choose jobs from these categories, they will have more choices than people who choose from “Social”, “Information”, and “Clerical”.
5.2 Relationship of Salary & Category and Salary & Degree Requirement
For people who are finding jobs, the number of salary is always one of the most important information they are interested in. To make our graphs more useful and not to disappoint the job seekers, we choose the lower bound of salary range from each job posting whose salary frequency is annual as the value of salary. Then we create the box plots related to salary & job category and related to salary & degree requirement.
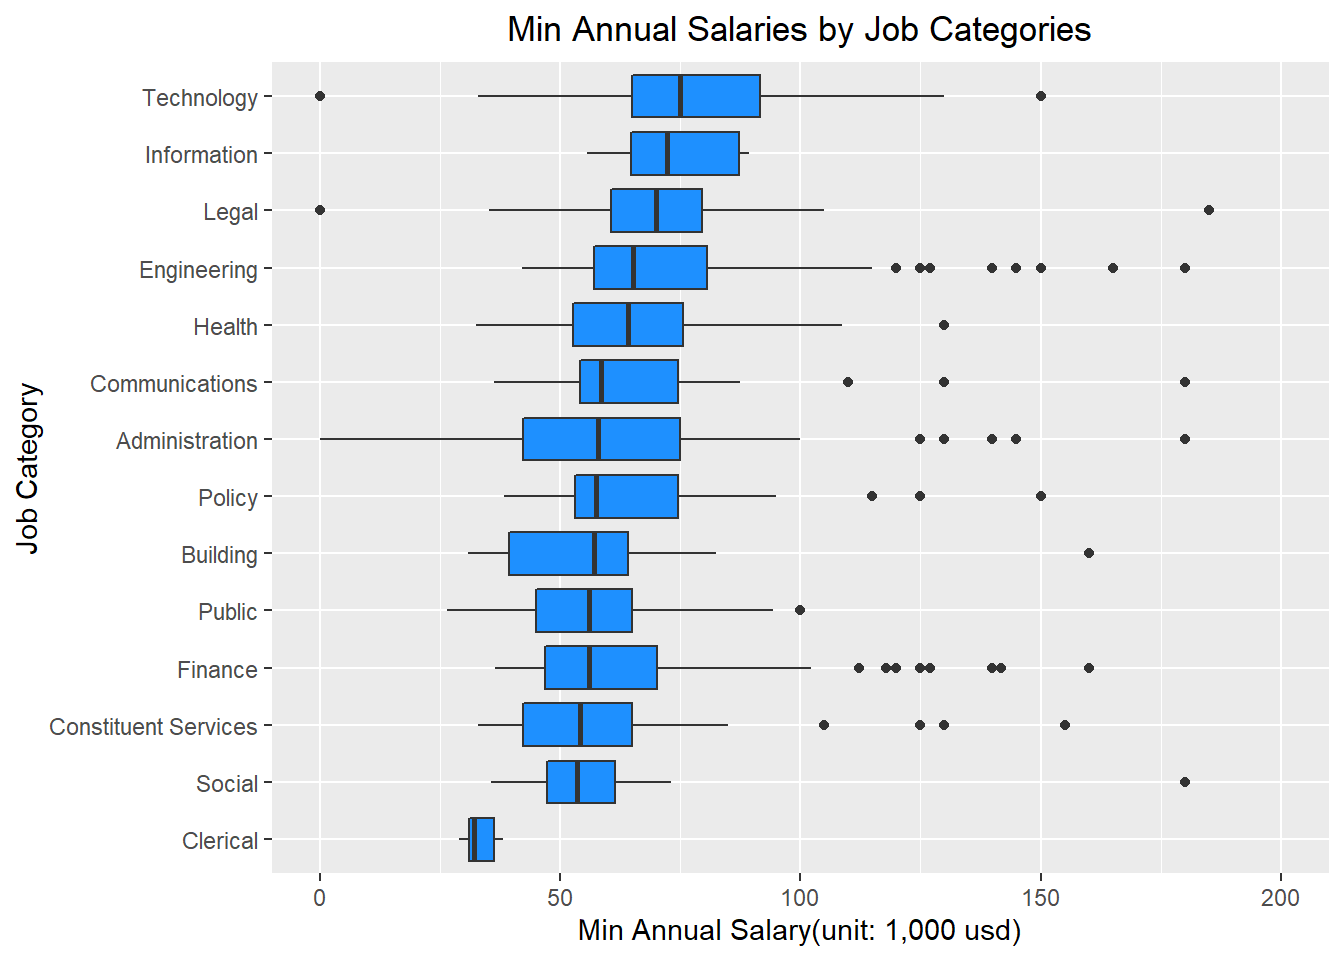
From the graph above, we can find except job categories “Clerical” and “Information”, for each other job category, there are some outliers in its salary distribution. What’s more, this graph shows that for those job postings whose job categories are “Technology” and “Information”, the amount of salary people can get is generally higher than those job postings whose job categories are “Social” and “Clerical”. In particular, for job category “Clerical”, the amount of salary people can get is generally lower than any other categories of job.
Combining with the first graph “Most Major Job Category” in section 5.1, we can notice that job category “Technology” not only has the largest variety of job postings, but also has better salary distribution than other job categories. For job category “Clerical”, it has the smallest variety of job postings and the almost worst salary distribution. However, more variety of job postings does not always equal to better salary. For job category “Information”, although it has the second lowest number of job postings, it ranks second in term of salary. In contrast, for job category “Constituent Services”, although it ranks second in the number of job postings, it has the third lowest salary.
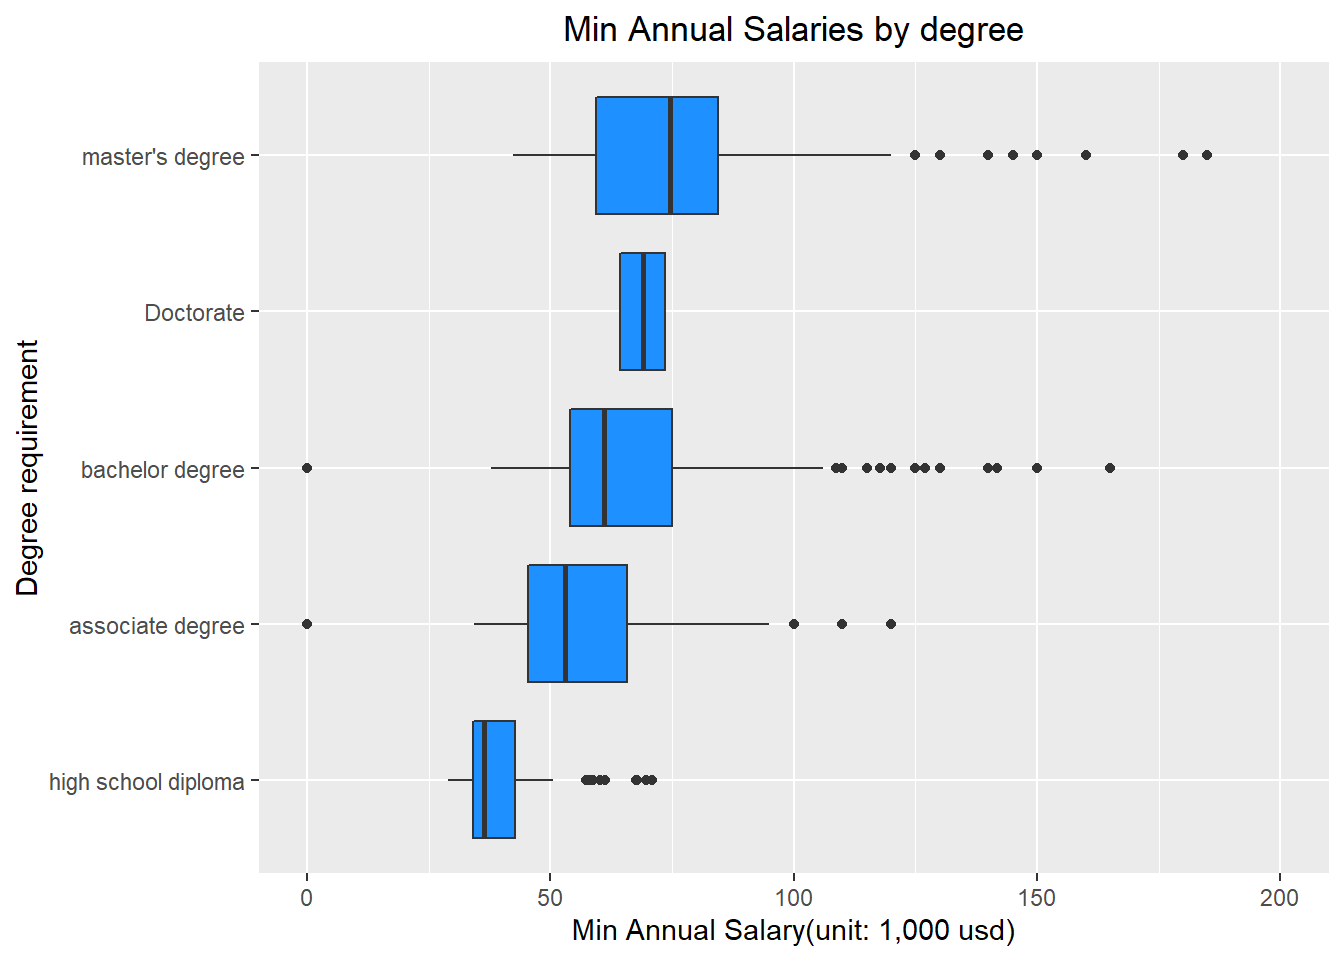
From this graph, it shows a trend that except “Doctorate” (since the number of job postings whose degree requirement needs “Doctorate” is very small), the higher the degree requirement, the higher the salary. For job postings that need master’s degree, the median of minimum annual salary is around 75000. But for those job postings that need associate degree, the median of minimum annual salary is just around 50000. Therefore, it is always beneficial for job seekers to improve their education level before looking for a job.
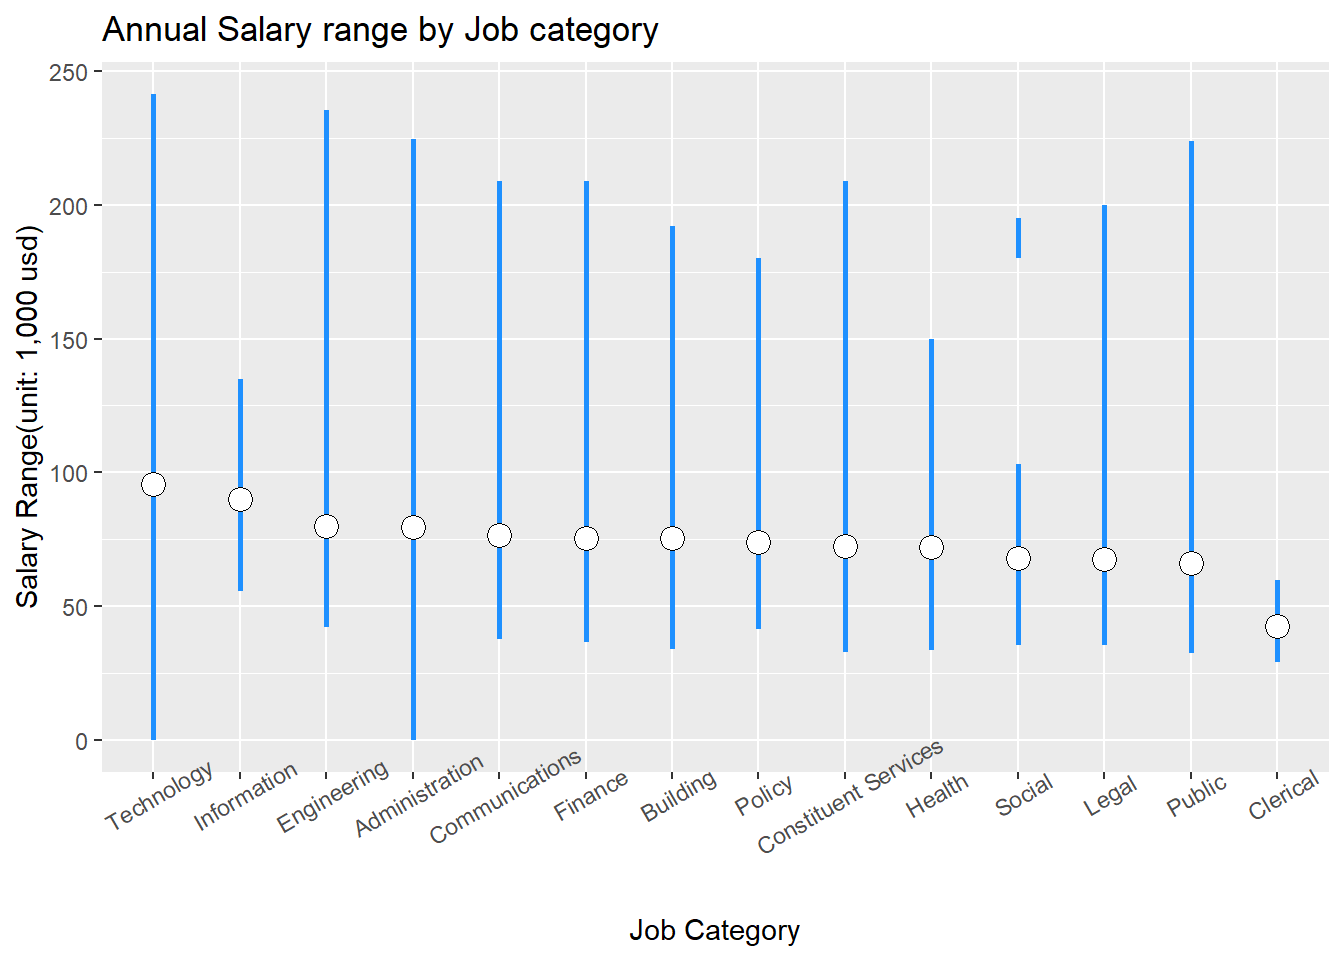
Sometimes it is not enough for job seekers to just know the information of minimum salary. Here we plot this graph to show the mean salary, the maximum salary, and the minimum salary job seekers can get from each job category. Combining with the first graph “Min Annual Salaries by Job Categories” in section 5.2, for job categories “Engineering”, “Administration”, “Constituent Services”, “Building”, “Finance”, and “Social”, they rank higher based on mean salary than they rank based on median of minimum salary. However, for job category “Legal”, although it ranks third in terms of median minimum salary, it has the second lowest number of mean salary, and the value of its mean salary is close to its median of minimum salary. This information shows job seekers who want to work in “Legal” job category can get a better minimum salary guarantee, but the salary they eventually get will not change much.
5.3 Residency requirement and Full-Time / Part-Time job indicator
Although this dataset contains the job postings available in New York City, some job postings are not available for all job seekers in New York City since there exists some job postings that need New York city residency requirement. Furthermore, some job postings are not suitable for job seekers who just want to find a full-time job or just want to get a part-time job. In this section, we will analyze the residency requirement and the full-time / part-time indicator in these job postings. We group all job postings according to their job categories.
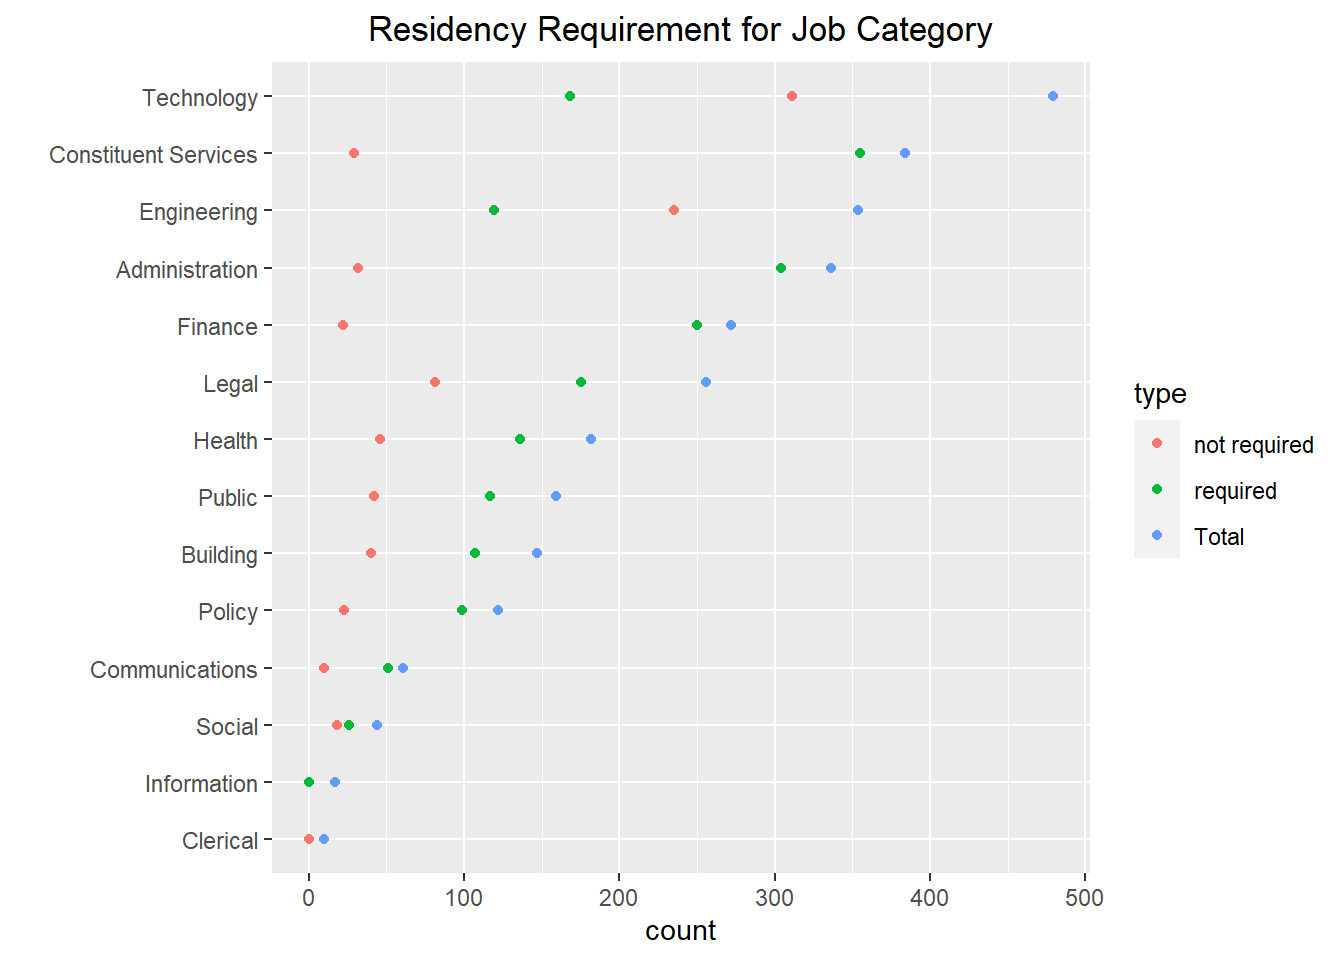
In this graph, for each job category, it shows the amount of job postings that require the residency requirement and the amount that do not require, and the total amount. We can find for job category “Information”, all of its job postings do not have residency requirement, and for job category “Clerical”, all of its job postings need residency requirement. What’s more, we notice that for most of the job categories, the amount of “required” is greater than the amount of “not required”. Only in job categories “Technology”, “Engineering”, and “Information”, the amount of job postings that do not require New York residency requirement is greater than the amount that require. This information shows now New York City provide a convenient employment environment for some international students whose major is about “Technology” or “Engineering”.
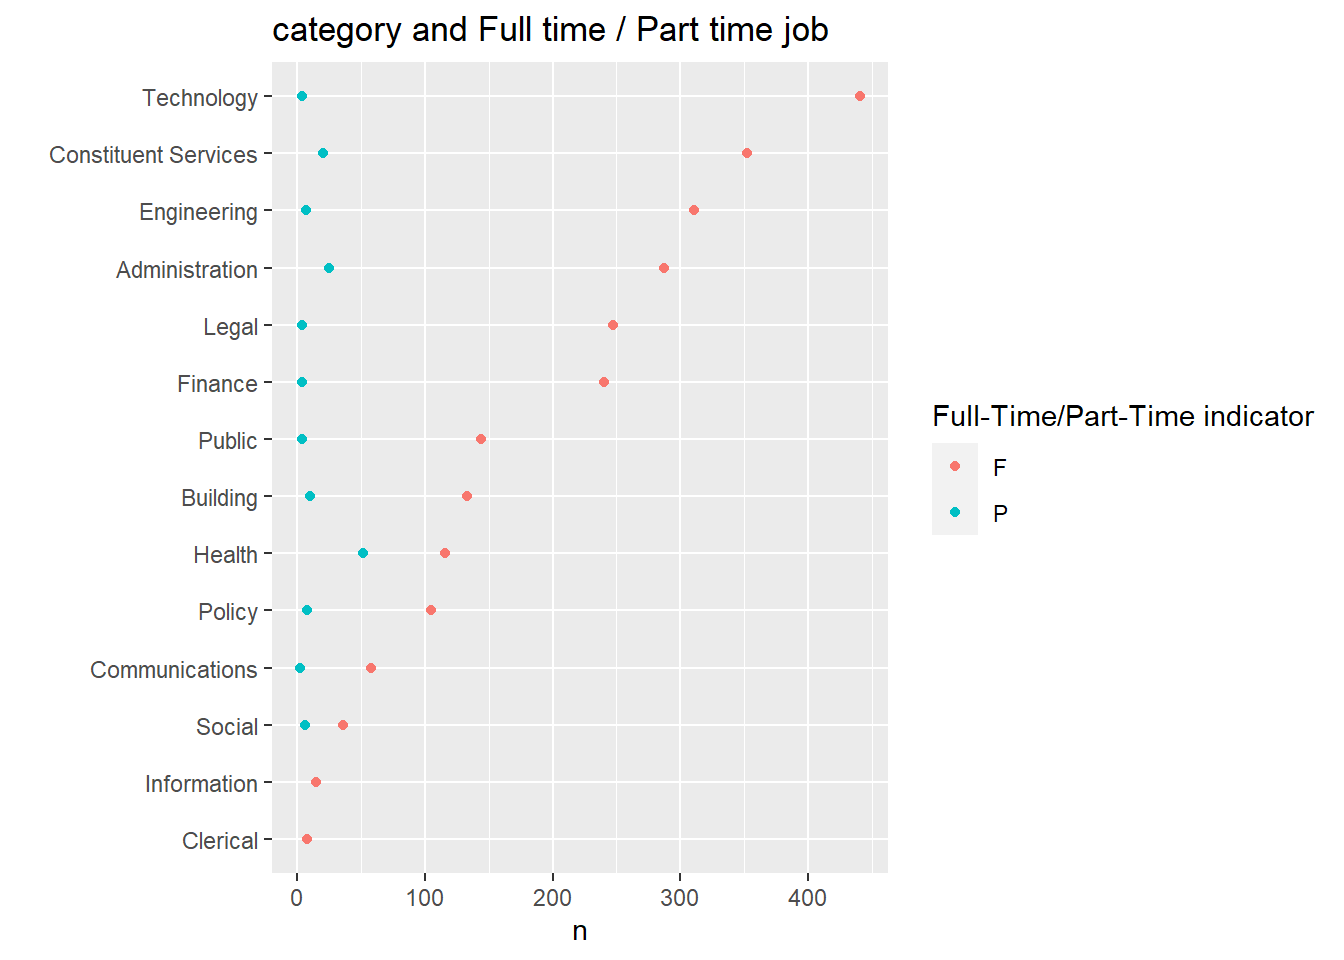
In this graph, we show the amount of full-time jobs and the amount of part-time jobs for each job category. It shows for job categories “Information” and “Clerical”, they just have full-time jobs. For all job categories, the amount of full-time jobs are greater than the amount of part-time job. It means that full-time work seems to have gone mainstream in New York. What’s more, we can find job category “Health” has the most number of part-time jobs. Thus, if you prefer to find a part-time in New York, “Health” category can provide more choices to you.
5.4 Degree requirement and Career Level
In this section, we focus on analyzing the two most important requirements that job seekers will pay attention to when they look through these job postings: Degree requirement and Career Level. We want to know whether a higher career level can substitute for higher degree level?
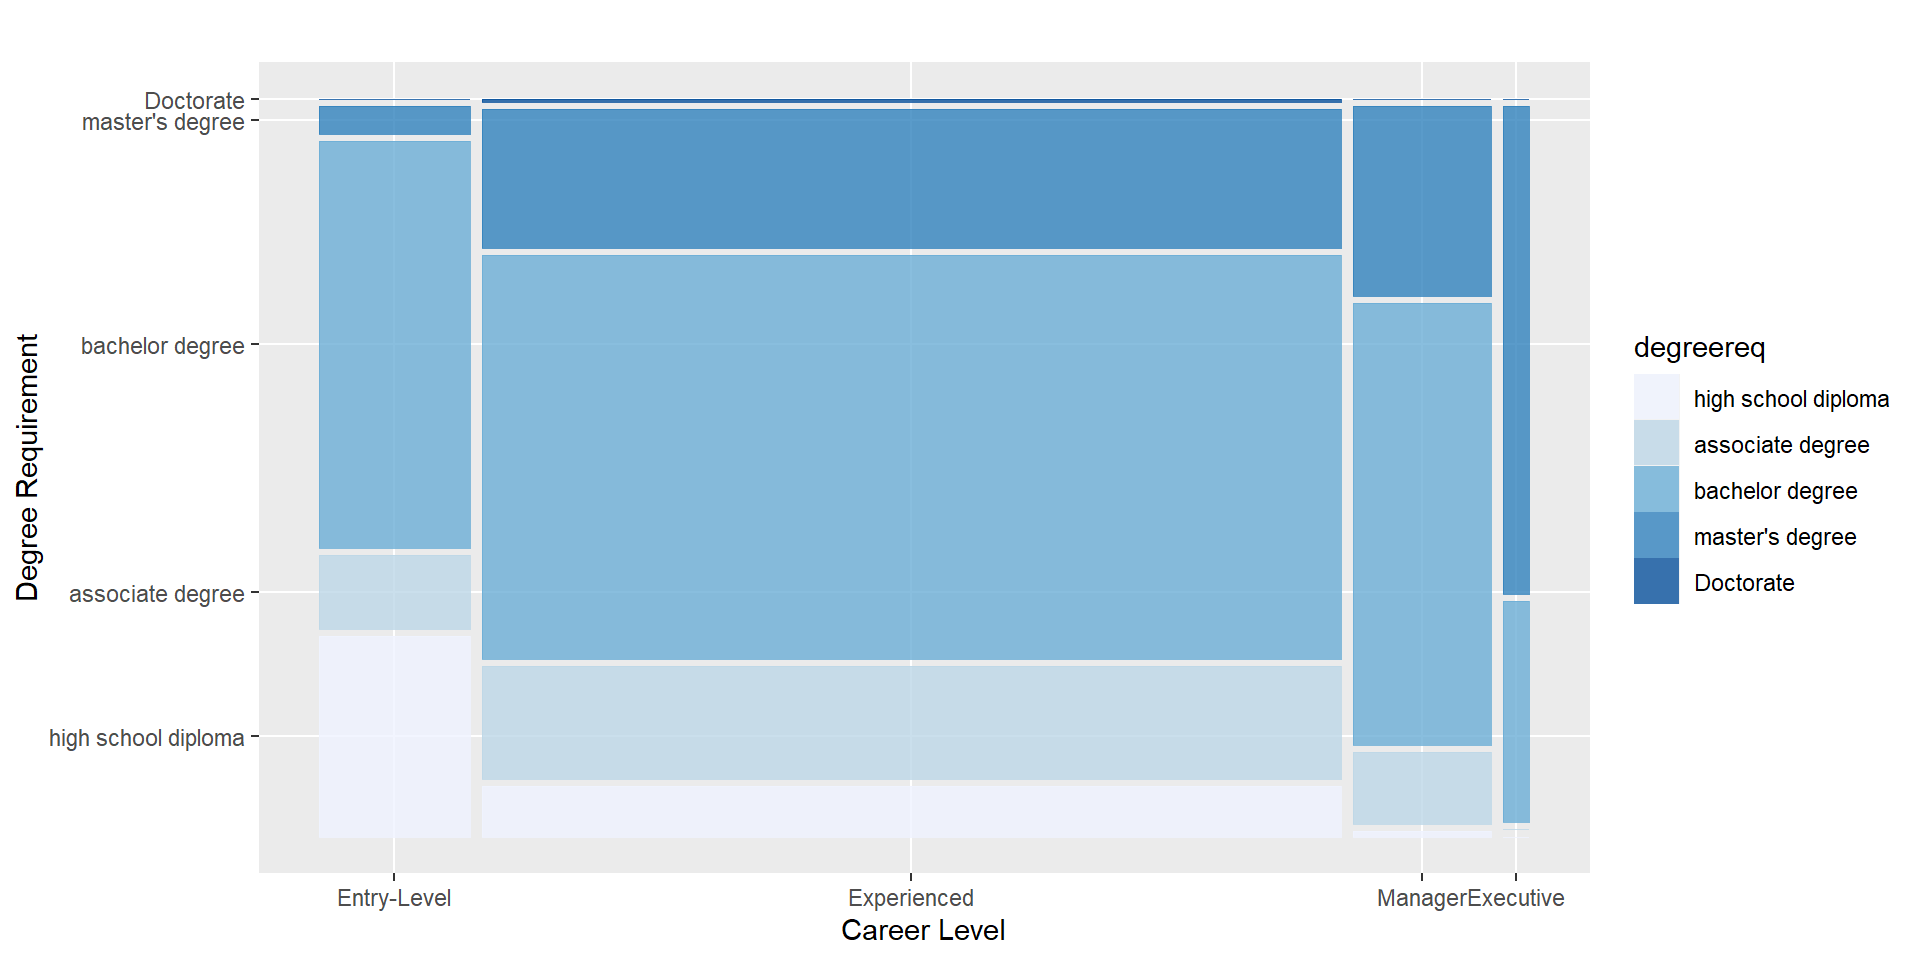
In this mosaic graph, it shows when career level changes from “entry-level” to “executive” (from low level to high level), the percent of high school diploma requirement become smaller and smaller, and the percent of master’s degree requirement become larger and larger. The percent of Doctorate requirement is very low for all of these career levels. Also, the percents of bachelor degree requirement and associate degree requirement are similar in career levels “entry-level”, “Experienced”, and “Manager”. But in career level “executive”, the percents of both degree requirement are almost 0, almost all degree requirements are from master’s degree and bachelor degree. Adding all these information together, we find higher career level cannot substitute for higher degree level, instead, when job postings’ career level become higher, their degree requirements also become higher and do not need people whose degree is low.
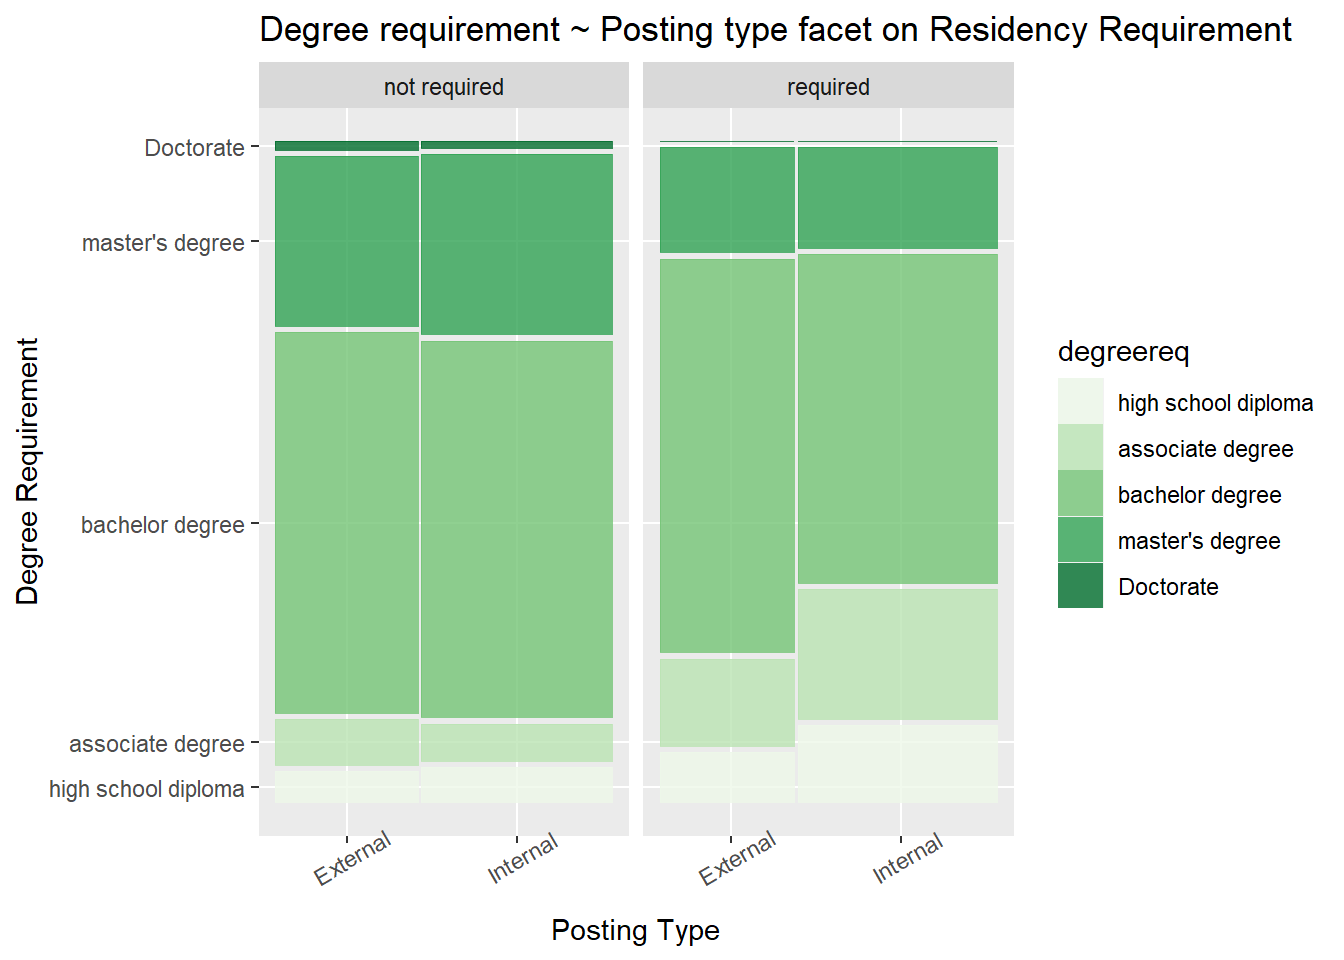
In this mosaic graph, we analyze the relationship between degree requirement and posting type & residency requirement.
For all job postings that do not require New York residency requirement: the degree requirement of external posting type is very similar to the degree requirement of internal posting type. The percent of bachelor degree requirement is more than 50% in both of these two posting type, which is the largest. The second largest percent of degree requirement is master’s degree, which is around 33%. The percent of Doctorate requirement is smallest.
For all job postings that requires New York residency requirement: The percents of Doctorate and master’s degree requirement are similar in both external and internal posting type. However, for job postings whose posting type is external, their percent of bachelor degree requirement is higher , and their percents of associate degree and high school diploma are smaller than those whose posting type is internal.
For all external job postings: we can find the percents of master’s degree and Doctorate degree requirement in “not required” are greater than those in “required”. This shows the external job postings that do not need New York residency have higher requirements for high-end degrees than external job postings that need New York residency.
Similar for internal job postings, the internal job postings that do not need New York residency have higher requirements for high-end degrees than internal job postings that need New York residency.
5.5 Title Classification
All NYC job positions have 4 job classes: competitive, non-competitive, exempt and labor. Competitive means these positions require examination. Exempt means competitive or non-competitive examinations or other qualification requirements are not practical. Labor Positions are positions is mainly engaged in unskilled manual labor, like cleaner and driver. Non-Competitive Positions are positions that are not in the exempt class or the labor class and examination has been determined to not be practicable. Is there any difference in salary between each class?
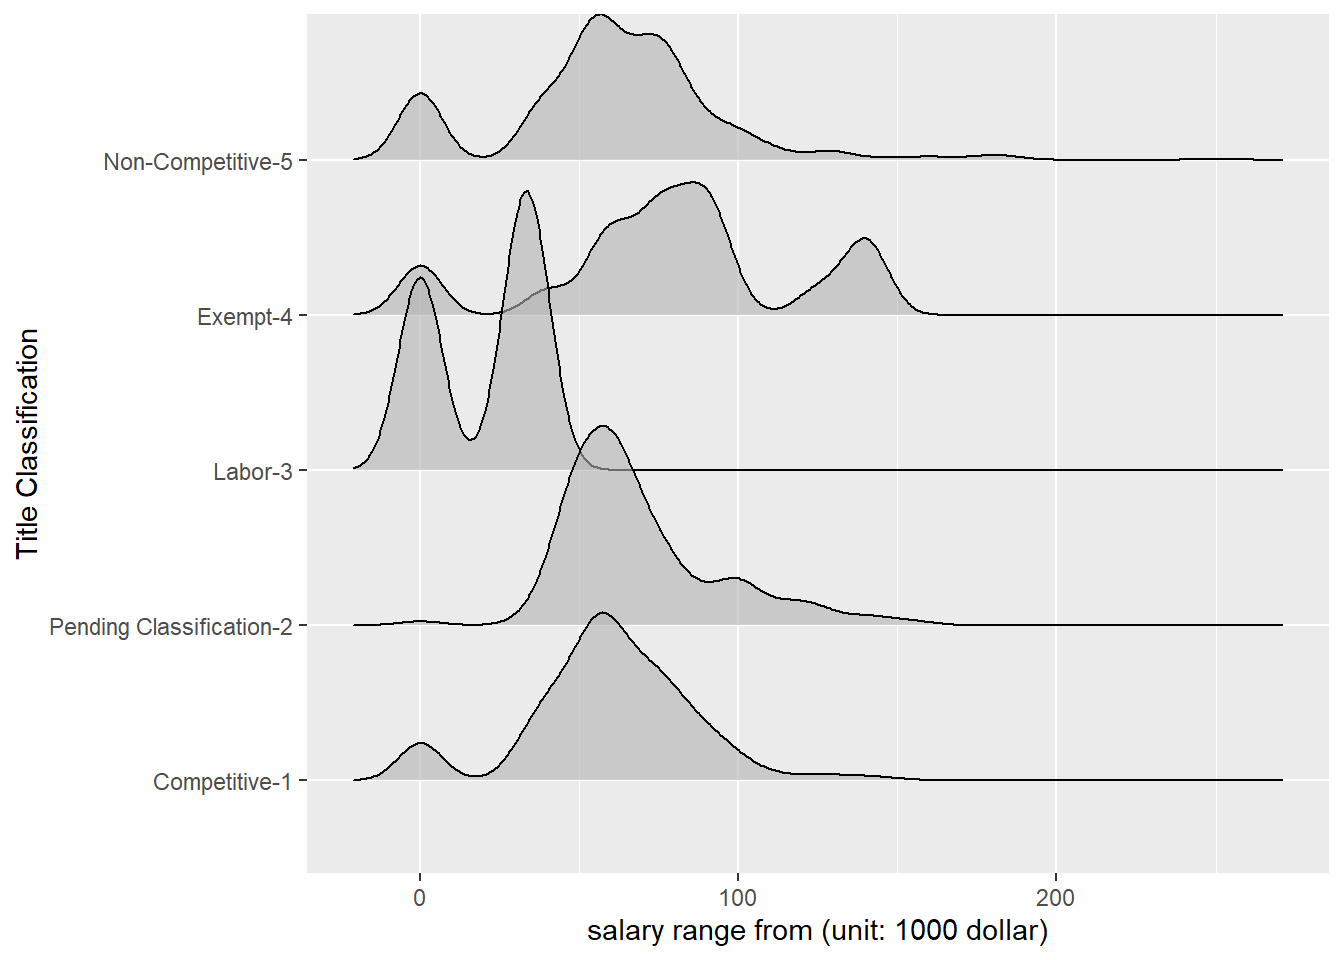
In this ridgeline plots, one for each kind of “Title Classification”, it shows us how the number of job postings of each title classification changes with the lower bound of salary range. We can find that for job postings whose title classifications are “Competitive-1”, “Pending Classification-2”, and “Non-competitive-5”, their low bound of salary range are concentrated around 50,000 dollars. “Exempt-4” is more likely to get a higher salary, with one peak near 100,000 dollars and one peak near 150,000 dollars. However, for job postings whose title classification is “Labor-3”, most of it low bound salary range is less than 50,000 dollars, which may because it is unskilled job.
5.6 External and Internal
Except the New York residency requirement, these job postings have another restriction variable “Posting Type” whose meaning is internal or external job posting. And the dataset claims that internal postings available to city employees and external postings available to the general public are included. To find more information about internal and external, we create a scatter plot to show the relationship between job category and this posting type.
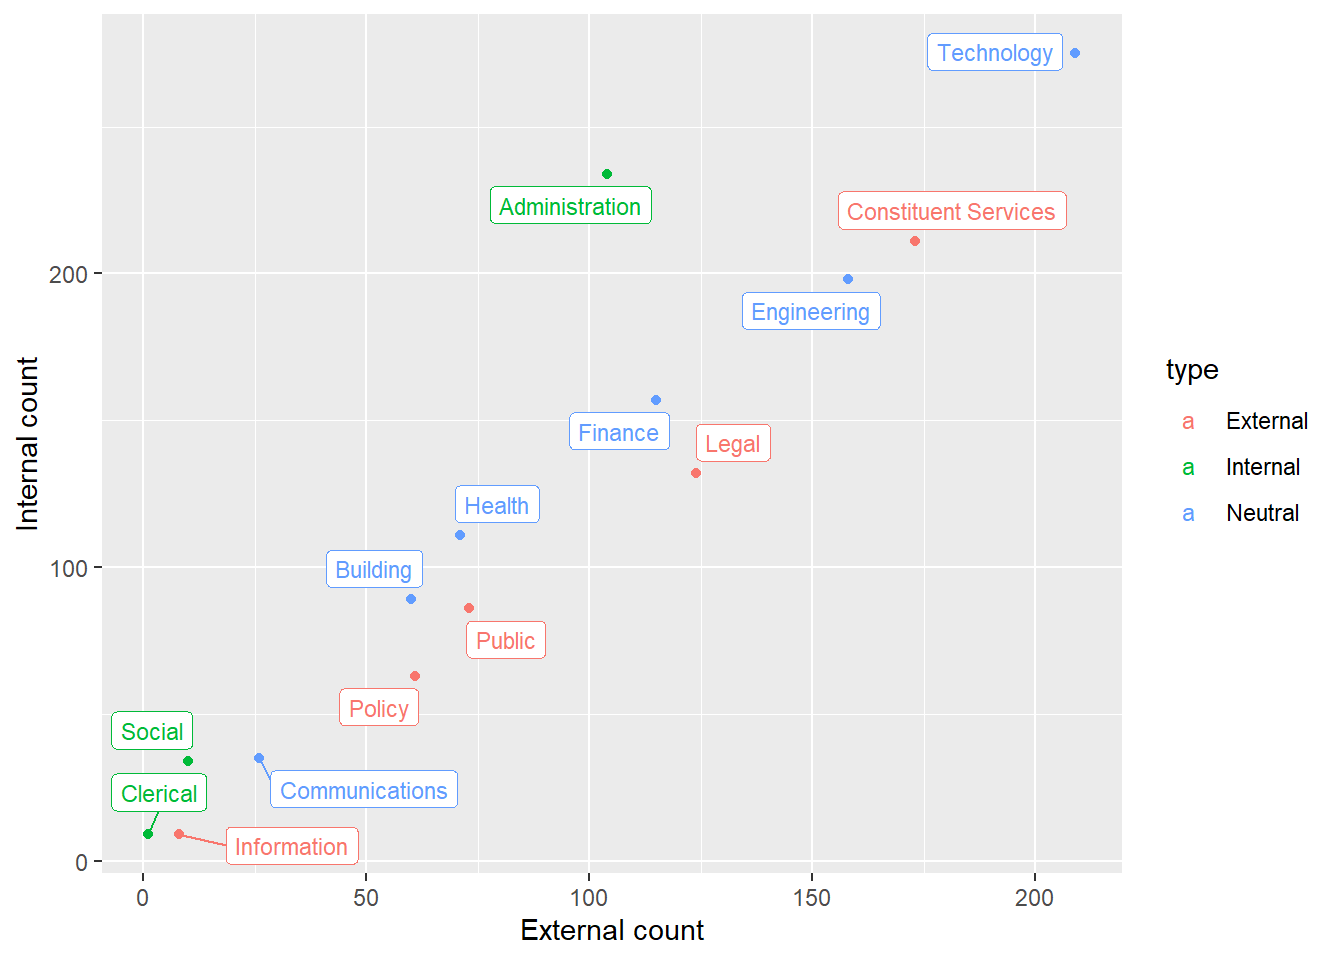
In this graph, for each job category, we set some categories are more “external” if its number of external job postings is greater than the number of internal job postings times 0.8, some categories are more “internal” if its number of external job postings is less than the number of internal job postings times 0.6, and else categories are “neutral”. From the graph, we can find for job categories “Clerical”, “Social”, and “Administration”, these categories are more “internal”. For job categories “Information”, “Policy”, “Public”, “Legal”, and “Constituent Services”, they are more “external”. Other categories are “neutral”. Thus, for job seekers who are not city employees now, it is difficult to work in Administration.
5.7 Word Cloud for Preferred Skills
We noticed that each job has a specific long paragraph to describe the Preferred Skills, so we will focus on the keywords that appear in Preferred Skills from the whole job posting dataset. By split all words and drop all meaningfuless word like conjunctions, numbers and symbols, we generate a worldcloud with 100 most frequent words.
There are many information we can extract from above wordcloud. For example, we can see that’Data’,‘Microsoft’,‘excel’ appear around 1000 times, and ‘team’,‘project’, ‘manage’ appear more than 500 times. This may indicate most employer expect the job seeker are familar with microsoft office and have basic data analysis ability. What’s more, experience with team project may also be a bonus for job seeker.